PyQt5 Matplotlib
Matplotlib 圖可以包含在 PyQt5 應用程式中。
需要匯入幾個模組:
from matplotlib.backends.backend_qt5agg import FigureCanvasQTAgg as FigureCanvas
from matplotlib.figure import Figure
import matplotlib.pyplot as plt
我們建立了一個名為 PlotCanvas 的控制元件,其中包含 Matplotlib 圖。

PyQt5 Matplotlib 示例
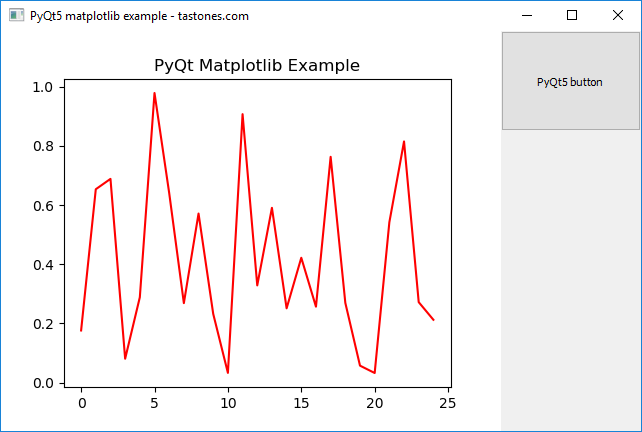
下面的示例在 PyQt5 視窗中嵌入 matplotlib 圖。
import sys

from PyQt5.QtWidgets import QApplication, QMainWindow, QMenu, QVBoxLayout, QSizePolicy, QMessageBox, QWidget, QPushButton
from PyQt5.QtGui import QIcon


from matplotlib.backends.backend_qt5agg import FigureCanvasQTAgg as FigureCanvas
from matplotlib.figure import Figure
import matplotlib.pyplot as plt

import random

class App(QMainWindow):

    def __init__(self):
        super().__init__()
        self.left = 10
        self.top = 10
        self.title = 'PyQt5 matplotlib example - tastones.com'
        self.width = 640
        self.height = 400
        self.initUI()

    def initUI(self):
        self.setWindowTitle(self.title)
        self.setGeometry(self.left, self.top, self.width, self.height)

        m = PlotCanvas(self, width=5, height=4)
        m.move(0,0)

        button = QPushButton('PyQt5 button', self)
        button.setToolTip('This s an example button')
        button.move(500,0)
        button.resize(140,100)

        self.show()


class PlotCanvas(FigureCanvas):

    def __init__(self, parent=None, width=5, height=4, dpi=100):
        fig = Figure(figsize=(width, height), dpi=dpi)
        self.axes = fig.add_subplot(111)

        FigureCanvas.__init__(self, fig)
        self.setParent(parent)

        FigureCanvas.setSizePolicy(self,
                QSizePolicy.Expanding,
                QSizePolicy.Expanding)
        FigureCanvas.updateGeometry(self)
        self.plot()


    def plot(self):
        data = [random.random() for i in range(25)]
        ax = self.figure.add_subplot(111)
        ax.plot(data, 'r-')
        ax.set_title('PyQt Matplotlib Example')
        self.draw()

if __name__ == '__main__':
    app = QApplication(sys.argv)
    ex = App()
    sys.exit(app.exec_())