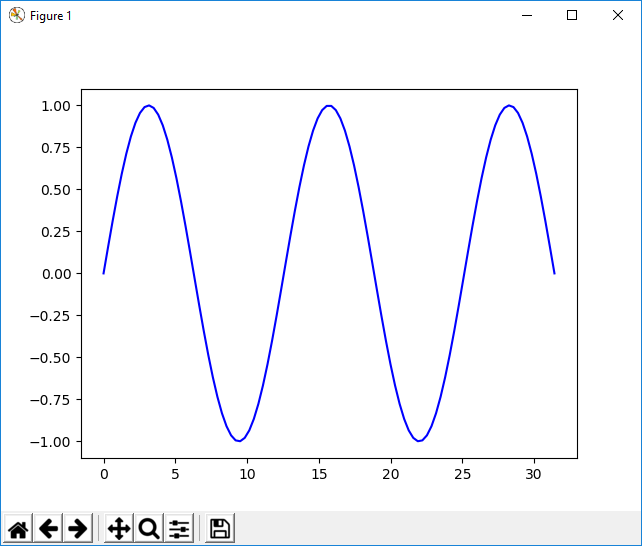
Matplotlib 更新繪圖
更新 matplotlib 圖很簡單。在迴圈中建立資料、繪圖和更新。設定互動模式至關重要:plt.ion()。這控制是否每次 draw() 命令重繪圖形。如果為 False(預設值),則圖形不會自動更新。
Matplotlib 更新繪圖示例
複製下面的程式碼以測試互動式繪圖。
import matplotlib.pyplot as plt
import numpy as np

x = np.linspace(0, 10*np.pi, 100)
y = np.sin(x)

plt.ion()
fig = plt.figure()
ax = fig.add_subplot(111)
line1, = ax.plot(x, y, 'b-')

for phase in np.linspace(0, 10*np.pi, 100):
    line1.set_ydata(np.sin(0.5 * x + phase))
    fig.canvas.draw()

解釋
我們建立要使用的繪圖資料:
x = np.linspace(0, 10*np.pi, 100)
y = np.sin(x)
使用以下命令開啟互動模式:
plt.ion()
配置圖形(b- 表示藍線):
fig = plt.figure()
ax = fig.add_subplot(111)
line1, = ax.plot(x, y, 'b-')
最後在迴圈中更新:
for phase in np.linspace(0, 10*np.pi, 100):
    line1.set_ydata(np.sin(0.5 * x + phase))
    fig.canvas.draw()